Our Portfolio
- Show All
- Amibroker
- Tradingview
- Python
- Metra Trader
- Excel
- Show All
- Amibroker
- Tradingview
- Python
- Metra Trader
- Excel
CandleStick Patterns
Bullish and Bearish candle stick patterns at swing low and swing high usually predict the price movement. Traders use candlestick patterns to predict future price movements based on past behavior. These patterns can signal potential buying or selling opportunities, helping traders make correct decisions.
Demand and Supply Zones
Demand refers to how many investors want to buy a stock, while supply is about how many are willing to sell it. Basically these zones focuses on identifying areas on a price chart where buying (demand) or selling (supply) is likely to occur, and allows traders to make decisions about when to buy or sell stocks.
Supertrend Pair Trading
Fibonacci Retracement
Fibonacci retracement is a tool used in trading to identify potential levels where a stock price might reverse its current trend. Fibonacci retracement levels, are derived from the Fibonacci sequence. By identifying these levels, traders can make more informed decisions about where to enter or exit trades.
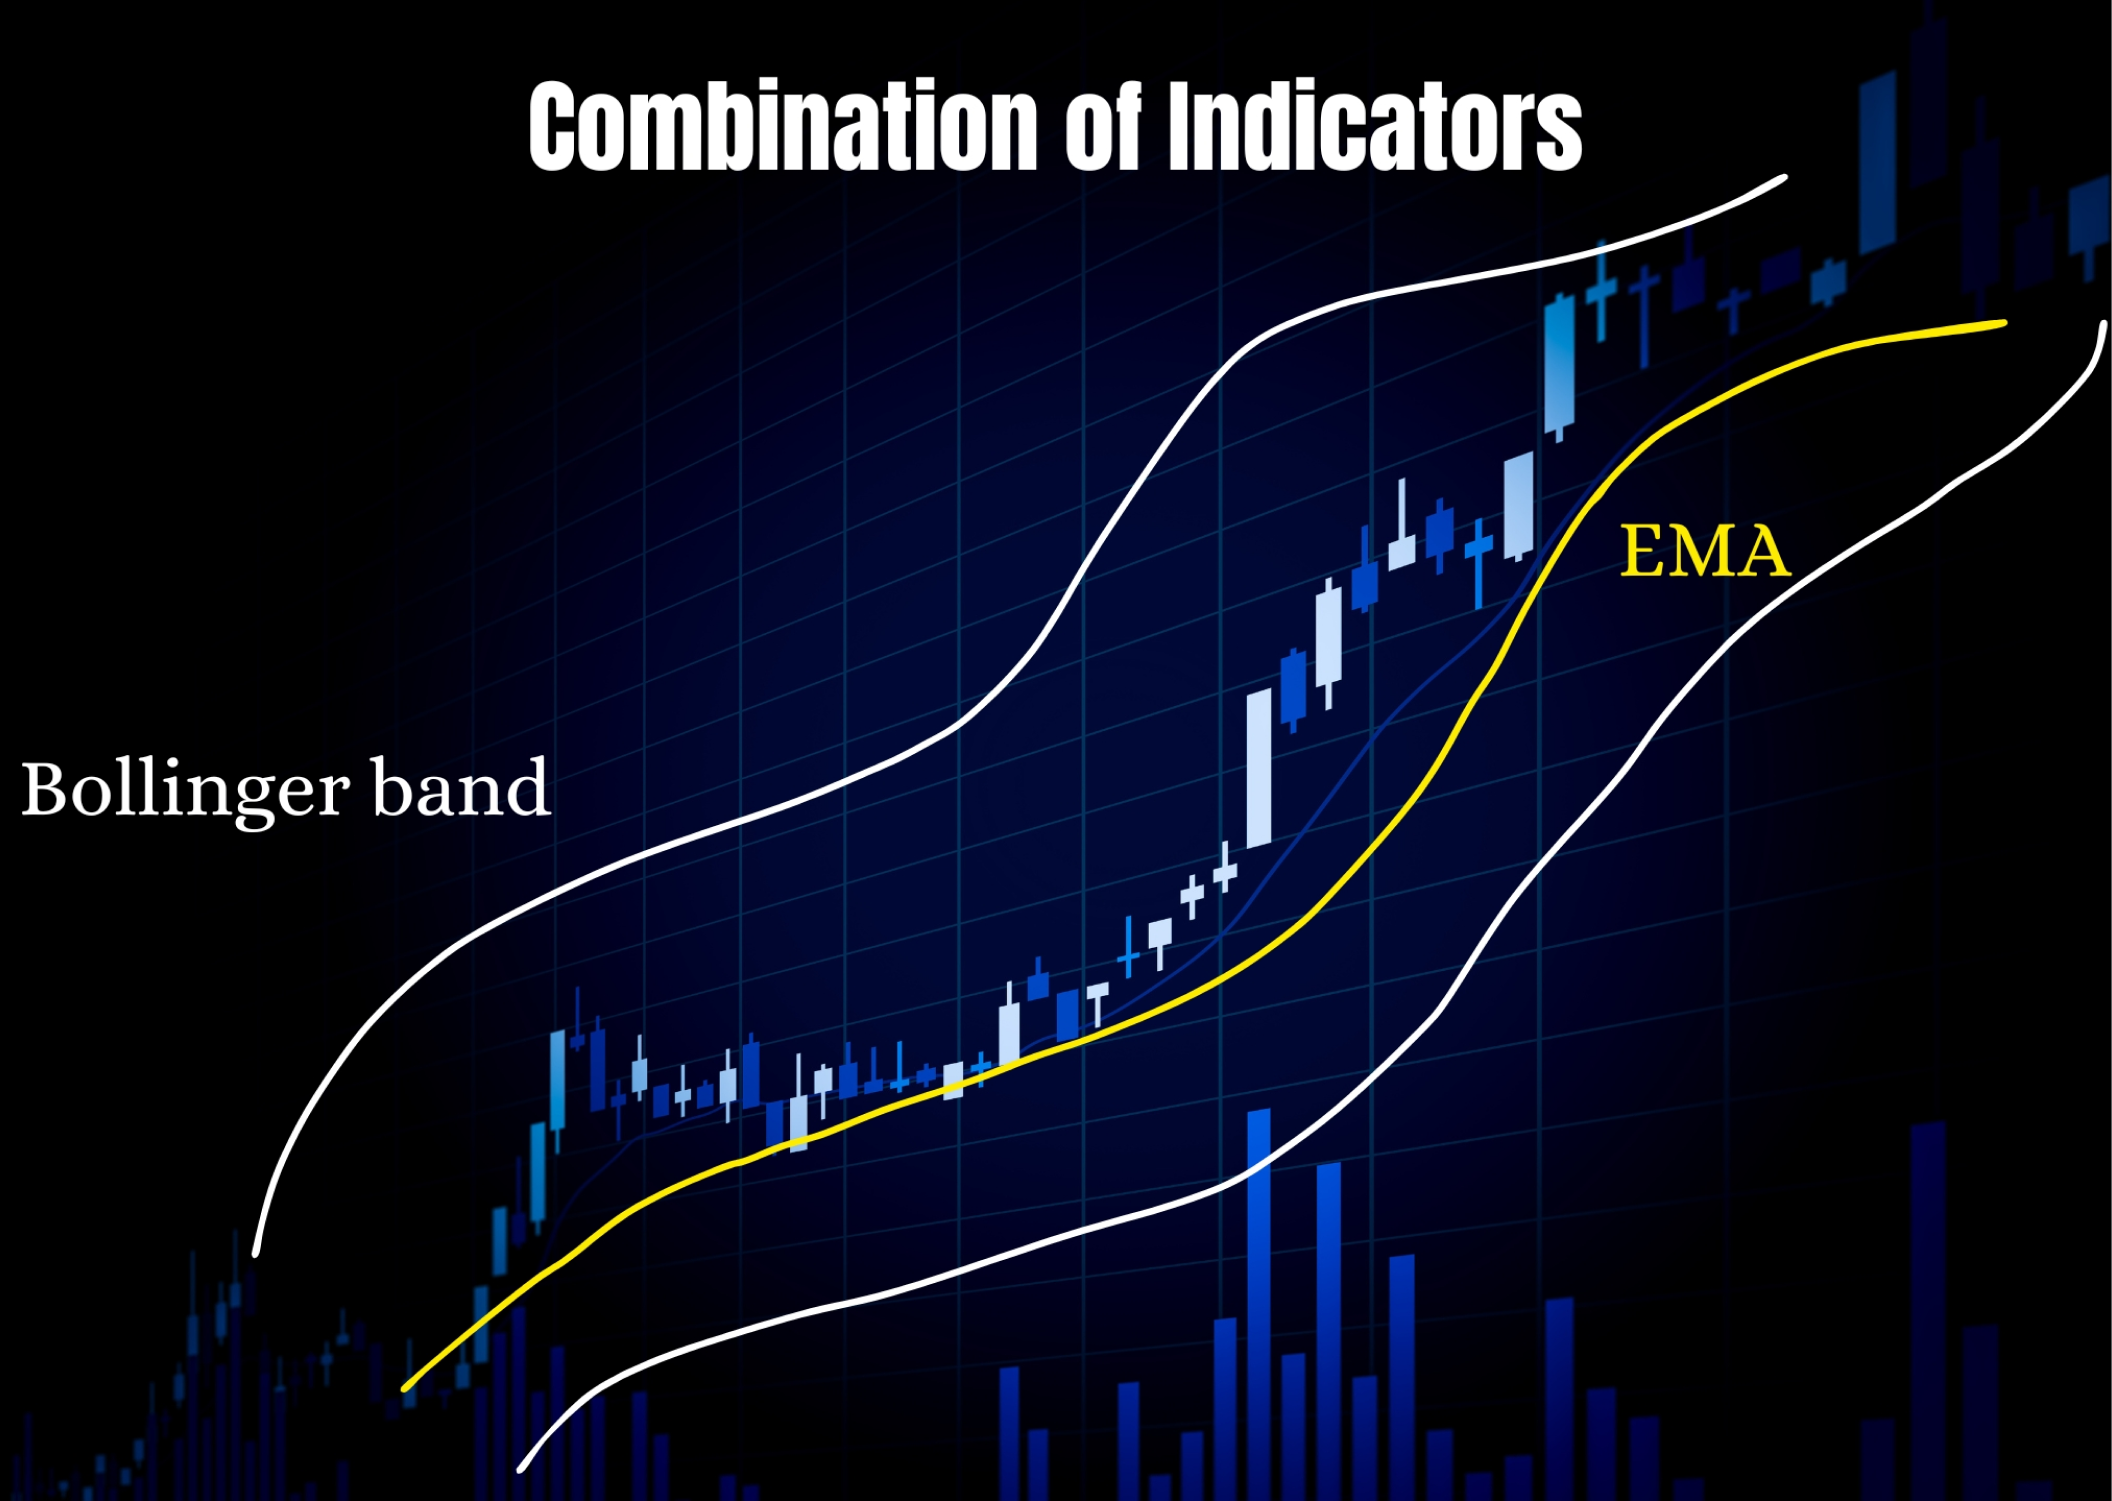
Bollinger Band
Bollinger Bands are plotted at a standard deviation level above and below a simple moving average of the price. It help traders understand market volatility and potential price reversals. By watching how the price interacts with the bands, traders can make decisions about when to buy or sell a stock.